Yield Management Reporting and Analysis System
yieldWerx with its advance wafer mapping software tool provides the ability to run multiple reports on multiple lots & wafers with a single click. The tool has an excellent tendency to generate wafer map reports using any format like JMP, Excel, CSV STDF, ATDF and many other industry formats. Some of the commonly used reports are:
Wafer Map
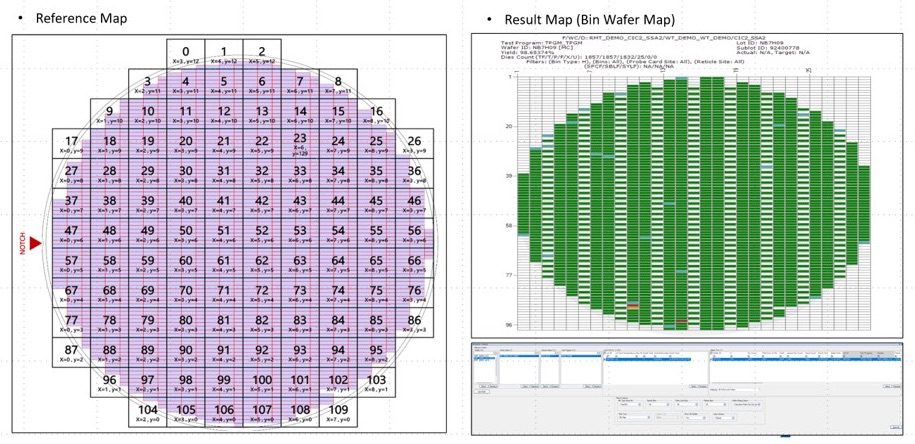
This report of yieldWerx’s wafer map software visually generates a representation of a wafer showing either Bins or Soft Bins. The report can be run for multiple wafers and multiple lots. The output of the reports can be aggregated by bin population/wafer yields by wafer, lot, or test program. You can compare multiple wafer maps using the wafer map thumb nail galleries to see if there are any repeating patterns across wafers. [Applicable to only Wafer Probe Data].
Stacked Wafer Map
In contrast to the single wafer map report, this report displays a stacked map representation of all the wafers for either Bins or Soft Bins, instead of showing the wafers as individual maps. The report can be run for multiple wafers and multiple lots. You can then drill down to the raw data by selecting any of the die on the wafer. [Applicable to only Wafer Probe Data].
Parametric Wafer Map
You can generate wafer maps for test parameters and visually see the distribution of results by die location. The report can aggregate data from multiple wafers and stack them for cross wafer or lot analysis. These analysis reports can also be run for parametric zonal analysis simply by sorting results by wafer. This report can be used for both Parametric as well as Functional test parameters. Options exist to screen/filter data based on Tukey and user defined limits. [Applicable to only Wafer Probe Data].
Parametric Failure Report
Data Reports: A very simple report that shows you the topmost failing tests based on limits included in the data source or user specified. Useful for showing you what tests are failing the most and for you to take corrective action on conversely you can also see which tests are failing the least and decide to modify the test program to take the non-critical ones out to save test times. [Applicable to both Wafer Probe as well as Final Test Data].
Wafer Probe Correlation & Analysis
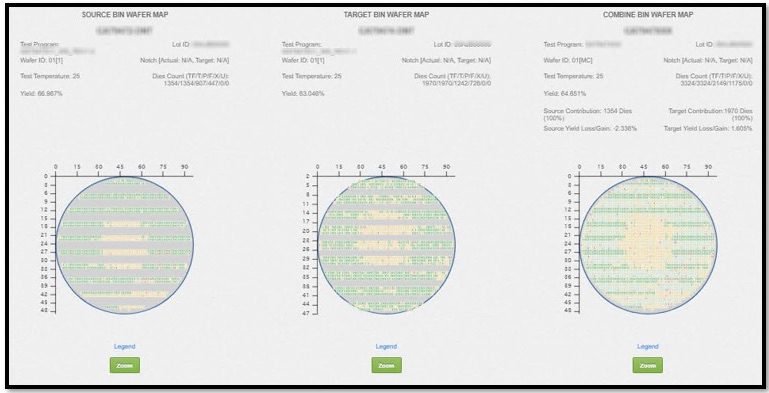
Suite of analysis reports enabling operators & engineers to efficiently correlate different test runs of data against each other. The report enables instant identification of yield management issues in cases where wafers & final testing occurs in multiple manufacturing & test sites. Quickly able to ensure that there are no test program or test equipment related issues when setups or test program changes are made. Saves valuable yield and test time. The reports support both Parameter-to-Parameter correlation as well as Bin correlation. T-Test is one of the options available in both report types.
To find more information, please schedule a demo with our technological experts.